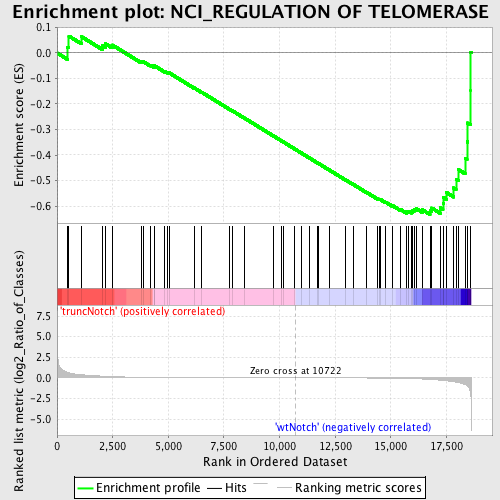
Profile of the Running ES Score & Positions of GeneSet Members on the Rank Ordered List
| Dataset | Set_03_truncNotch_versus_wtNotch.phenotype_truncNotch_versus_wtNotch.cls #truncNotch_versus_wtNotch |
| Phenotype | phenotype_truncNotch_versus_wtNotch.cls#truncNotch_versus_wtNotch |
| Upregulated in class | wtNotch |
| GeneSet | NCI_REGULATION OF TELOMERASE |
| Enrichment Score (ES) | -0.633194 |
| Normalized Enrichment Score (NES) | -1.4689683 |
| Nominal p-value | 0.024886878 |
| FDR q-value | 0.69610316 |
| FWER p-Value | 1.0 |
| PROBE | DESCRIPTION (from dataset) | GENE SYMBOL | GENE_TITLE | RANK IN GENE LIST | RANK METRIC SCORE | RUNNING ES | CORE ENRICHMENT | |
|---|---|---|---|---|---|---|---|---|
| 1 | MAPK3 | 580161 4780035 | 477 | 0.653 | 0.0233 | No | ||
| 2 | SMAD3 | 6450671 | 532 | 0.607 | 0.0660 | No | ||
| 3 | IRF1 | 2340152 3450592 6290121 6980577 | 1095 | 0.374 | 0.0639 | No | ||
| 4 | RBBP4 | 6650528 | 2043 | 0.210 | 0.0286 | No | ||
| 5 | NFKB1 | 5420358 | 2171 | 0.193 | 0.0362 | No | ||
| 6 | E2F1 | 5360093 | 2480 | 0.155 | 0.0312 | No | ||
| 7 | FOS | 1850315 | 3778 | 0.065 | -0.0338 | No | ||
| 8 | FRAP1 | 2850037 6660010 | 3862 | 0.062 | -0.0336 | No | ||
| 9 | SIN3B | 6650253 | 4191 | 0.052 | -0.0474 | No | ||
| 10 | EGFR | 4920138 6480521 | 4355 | 0.047 | -0.0527 | No | ||
| 11 | HSP90AA1 | 4560041 5220133 2120722 | 4376 | 0.046 | -0.0502 | No | ||
| 12 | TINF2 | 2360358 | 4847 | 0.037 | -0.0728 | No | ||
| 13 | WRN | 540687 1240093 | 4960 | 0.035 | -0.0763 | No | ||
| 14 | RAD1 | 4200551 | 5030 | 0.033 | -0.0775 | No | ||
| 15 | JUN | 840170 | 6162 | 0.019 | -0.1370 | No | ||
| 16 | TERT | 6660075 | 6488 | 0.017 | -0.1533 | No | ||
| 17 | IL2 | 1770725 | 7742 | 0.009 | -0.2201 | No | ||
| 18 | WT1 | 3990463 | 7870 | 0.009 | -0.2262 | No | ||
| 19 | IFNG | 5670592 | 8428 | 0.007 | -0.2557 | No | ||
| 20 | XRCC5 | 7100286 | 9727 | 0.003 | -0.3255 | No | ||
| 21 | ESR1 | 4060372 5860193 | 10107 | 0.002 | -0.3458 | No | ||
| 22 | RPS6KB1 | 1450427 5080110 6200563 | 10168 | 0.002 | -0.3489 | No | ||
| 23 | TERF1 | 2340113 | 10676 | 0.000 | -0.3762 | No | ||
| 24 | SP3 | 3840338 | 10972 | -0.001 | -0.3920 | No | ||
| 25 | AKT1 | 5290746 | 11364 | -0.002 | -0.4130 | No | ||
| 26 | POT1 | 5340184 | 11709 | -0.003 | -0.4313 | No | ||
| 27 | RAD9A | 110300 1940632 3990390 6040014 | 11765 | -0.003 | -0.4340 | No | ||
| 28 | MYC | 380541 4670170 | 12225 | -0.005 | -0.4584 | No | ||
| 29 | NR2F2 | 3170609 3310577 | 12973 | -0.008 | -0.4980 | No | ||
| 30 | NBN | 730538 2470619 4780594 | 13305 | -0.010 | -0.5151 | No | ||
| 31 | ATM | 3610110 4050524 | 13898 | -0.015 | -0.5458 | No | ||
| 32 | BLM | 520619 5570170 | 14407 | -0.022 | -0.5715 | No | ||
| 33 | TNKS | 2760563 | 14470 | -0.023 | -0.5731 | No | ||
| 34 | CDKN1B | 3800025 6450044 | 14515 | -0.024 | -0.5736 | No | ||
| 35 | YWHAE | 5310435 | 14779 | -0.030 | -0.5855 | No | ||
| 36 | SAP18 | 3610092 | 15068 | -0.040 | -0.5981 | No | ||
| 37 | PTGES3 | 2190440 2680524 | 15425 | -0.056 | -0.6131 | No | ||
| 38 | TERF2IP | 580010 870364 2190358 | 15718 | -0.075 | -0.6232 | Yes | ||
| 39 | UBE3A | 1240152 2690438 5860609 | 15786 | -0.080 | -0.6208 | Yes | ||
| 40 | EGF | 5220154 | 15914 | -0.089 | -0.6210 | Yes | ||
| 41 | SMG6 | 5820243 | 15986 | -0.095 | -0.6177 | Yes | ||
| 42 | RAD50 | 4050184 6770746 | 16046 | -0.100 | -0.6133 | Yes | ||
| 43 | MAPK1 | 3190193 6200253 | 16153 | -0.109 | -0.6108 | Yes | ||
| 44 | ABL1 | 1050593 2030050 4010114 | 16410 | -0.138 | -0.6143 | Yes | ||
| 45 | IFNAR2 | 4070687 7100484 | 16762 | -0.188 | -0.6190 | Yes | ||
| 46 | SP1 | 6590017 | 16838 | -0.205 | -0.6077 | Yes | ||
| 47 | HDAC1 | 2850670 | 17220 | -0.280 | -0.6072 | Yes | ||
| 48 | MAX | 5220021 | 17346 | -0.317 | -0.5901 | Yes | ||
| 49 | TERF2 | 3840044 | 17372 | -0.324 | -0.5672 | Yes | ||
| 50 | RBBP7 | 430113 450450 2370309 | 17510 | -0.357 | -0.5477 | Yes | ||
| 51 | SIN3A | 2190121 | 17828 | -0.476 | -0.5291 | Yes | ||
| 52 | MRE11A | 3850601 4670332 | 17933 | -0.523 | -0.4954 | Yes | ||
| 53 | SAP30 | 5080735 | 18044 | -0.582 | -0.4576 | Yes | ||
| 54 | NCL | 2360463 4540279 | 18341 | -0.807 | -0.4130 | Yes | ||
| 55 | XRCC6 | 2850450 3870528 | 18427 | -0.927 | -0.3480 | Yes | ||
| 56 | HDAC2 | 4050433 | 18455 | -0.999 | -0.2744 | Yes | ||
| 57 | CCND1 | 460524 770309 3120576 6980398 | 18589 | -1.801 | -0.1464 | Yes | ||
| 58 | PARP2 | 4920039 6510097 1500750 | 18594 | -1.968 | 0.0012 | Yes |

